If you work in web design, you probably use or have access to a google analytics account and if you have an account, you probably know that a new version has been rolled out over the past couple of months. I’ve spent some time working with the new analytics and while there are great new features, there are other things that equally annoy me and make me want to revert back to the old layout.
What I like
Real Time Traffic Data

I personally think this is a pretty cool feature. Being able to follow what users are viewing right then and there could be really beneficial information. If you’ve just launched a site or sent out a newsletter, you can follow how many users are on the site, where they’re from and what content they’re viewing. Maybe the only down side is that the statistics only last 30 minutes and some email campaign senders already provide similar information. I’ve also found it can sometimes lag or stop if you’re on the page too long.
Visitors Flow

The closest you could get to learning how users navigated through your site before was by looking at a page’s navigation summary. The Visitors Flow now offers a lot more clearer image, highlighting the path users take and even noting the drop-off rates for individual pages. I also like how you can highlight or view individual segments (e.g. Australian views only) and change what variables you base the flow on (e.g city, source, browser). I think this makes viewing and analyzing user’s navigation a much easier process and more useful.
Region and City views for Locations Map

I was originally really annoyed at the locations map because it only showed visitors by state regions instead of detailed city locations seen in the old analytics version. Well much to my surprise, there’s actually a small tab (will talk about these later) to switch between region and city views, which is actually quite a nice touch. There is now also a magnify feature, allowing you to more clearly view cities that are huddled close together.

Search Engine Optimisation with Webmaster Tools

I had never really used Webmaster Tools until I found the Search Engine Optimisation panel in the side menu. What I discovered is that if you have a Google webmaster account (another free google service) you can now link it with your analytics account and can see how many impressions your site content is getting from searched queries.

The results from these can seem a bit odd until to you also compare it to secondary dimensions. My favourite is ‘Google Property’, which allows you to see where your content was viewed. This can mean that a popular search impression may have come from google images instead of the google search.
More Comparable Variables

I think I’ve hinted at this a few times already in this post. One of the nicest things to come out of this update is the ability to compare your data against a whole new variety of variables. This can be found in most sections, offering you to compare a secondary dimension to the current provided details. I find this is really useful when looking at individual page statistics. Before I was limited to the navigation summery, entrance sources and keywords. Now I can see what city people were from or what browser they used just for that page. It’s great that we can now get a lot more in-depth information for specific content.
Site Speed

It’s interesting that along with providing viewing statistics, google have introduced features that can aid you in optimising your site. Site Speed is one of those. It’s good to see what pages are taking the longest to load so you can correct this. It seems to exclude pages that have 0.00 load time, so you’re getting an average of the pages that are taking longer. I also like the Map Overlay that allows you to see where your site content is loading slowest.

What I don’t like
New Account List Page

One of the things I loved about the old analytics was when you first logged in you could see an overview of all your websites with how many page views and what percentage this was up or down from the previous month. It didn’t tell you much but it let you easily see how your sites were going. Now when I’m log in I get none of these details, just a list of of my accounts. The page just looks so boring and I feel that more could’ve been done with it. I’m now prone to switching back to the old version just to look at the home page to see this information.
New Dashboards

What I loved about the old dashboard was that it gave me a nice basic summery of what was going on with my site. How many visitors were viewing the site, how long they were there, where they where from, how they had accessed the site and what were the most popular pages. Easy and simple.
Now I log in and I’m not even taken to a dashboard as such. They (you can now have multiples) are now housed under the ‘Home’ tab, though why it’s called home when I open into standard reporting baffles me. When I do decide to look at the dashboard, it doesn’t really tell me much either. If you want to see a dashboard similar to the old version, you’re gonna have to create your own and you’re going to have to do this for every account as well since they don’t seem to carry over to your other accounts.
I don’t like being stuck to a 3 column structure because everything feels so cramped together, even on larger screens. The display of the statistics are limited mainly to graphs, tables and pie charts. This may sound picky but I was really annoyed that I couldn’t get the actual map for the country statistics (unless I’m mistaken in which case tell me how!). I think it was a lot quicker and more visually appealing to look at an actual map than to just have a table with the data in it.
Hard-to-Find Information

This isn’t so much something I don’t like but something I think could’ve have done better. It appears that since there’s a lot more information on offer to users, Google has placed them under small tabs above the table data and featured graph/image (highlighted in red in above pic). The problem I’ve found (and still continue to find) is that because the tabs are quite small I seem to miss them completely. This has lead to many moments of “where the hell is this information?! Why would they get rid of that?! Stupid new Analytics! *2 weeks later* Ohhhhh, there it is -_-“.
I remember being really annoyed that I couldn’t view the navigation summery anymore only to find it much later. This even happened recently when looking at the Locations map and being unable to find the city view. I feel that if the little tabs had been made more obvious, people like me wouldn’t keep missing them and in turn wouldn’t miss out on important information.
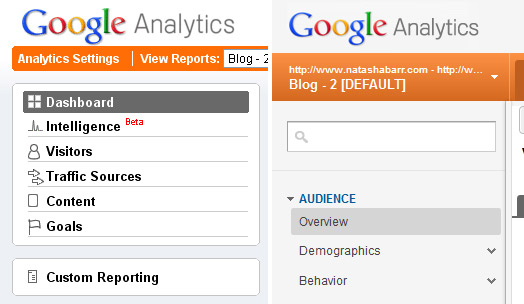
Changes to Side Menu Titles

This ties into the previous item. Because data is now listed under small tabs and therefore no longer in the side menu, sometimes finding what section they’re listed under to begin with can be a little frustrating. This was especially the case when I first started using the new analytics and the side menu had completely new titles for different sections. It’s something that you just have to get used to though so it’s not a huge problem.
Visitor Trending Statistics

This isn’t a big deal but I’ve noticed that the Visitor Trending section has been removed, probably because it can be found on nearly every other page above the top graph/information (pic above). What I would’ve liked though is to able to see the change difference percentage when comparing to past data. All I get now is a list of the current and past month values on the Audience Overview page, which doesn’t look that good. It would be nice to know the change difference between basic stats like Views, Time on Site and Bounce Rate without having to break out the calculator. Some may think I’m being lazy but in my opinion if it was in the previous version of analytics, it should be included in the new one.
Indifferent
I know there are a few things I haven’t commented on, mostly because I don’t use them. Features like Custom Variables I haven’t really looked into and Ad words/Conversions are features that at the current time I’m not really interested in.
The other feature I haven’t touched on is the new Social Engagement section. I’ve had a quick look at this and if setup I believe it would be quite valuable. It appears there’s some coding involved to get this going which has kind of put me off looking into it. I imagine this would be troublesome for people who would like to track these items but aren’t code-savvy enough to implement it. If anyone has used these let me know if it was useful to you.
Conclusion
So the new version of analytics definitely provides great new insights and in-depth details into how people are viewing and navigating our websites. On the other hand, some of the layout designs for the new pages could have been more thought out so they didn’t look boring or made information hard to find. I guess it’s come down to function over form in this case. That said, quite recently I’ve noticed new changes on some minor elements so who knows what else they have in store in the future. I’m willing to tolerate the things I don’t like in order to see if Google will upgrade them at a later point.
So what do you guys think? Do you like the new analytics or not?
(Supplied images from Google analytics blog and Casey blog post).


I am really annoyed at the new design for Google Analytics but imagine I’ll get over it after a few tries. I understand that Google is trying to make all of it’s services similar to Google Plus but honestly it just doesn’t work. I liked the old design because it was easy to use and navigate. I picked it up really quickly as a website rookie, now though it feels to technical and not very user friendly.
I don’t understand the need to completely overhaul the service instead of making little tweaks. The visitor overview is quite impressive and real time will be useful. It’s a shame but I guess I’m stuck using this service.
Hi,
Thank you for your Internet post.
The old version of GA’s city map showed city locations as much smaller orange dots.
The newer (2012) version uses huge dots…e.g. 4 visits to a city in the U.S. shows up as an orange dot that almost covers half the U.S.
Is there any way to revert back to the old visualization using smaller dots?
You post says there would be more on this, but I can’t find it. Perhaps I missed it.
Thanks,
Nick
I don’t believe there is any way to revert back to old visualisation anymore since they removed the option to switch between the two versions quite a while ago.
I don’t intend to write anymore about Google Analytics for the time being, sorry if my post gave that impression 🙂